


Our Methodology
The Archaeological Mapping Lab employs many techniques and technologies related to geospatial documentation, analysis, visualization and simulation as part of its methodology. In particular, the Lab specializes the fields of drafting, cartographic modeling & spatial analysis and multi-dimensional visualization. The aim of such a rigorous methodology is to assist in an efficient, effective and accurate publication of the findings of the various research initiatives within the AML.
Drafting
AML primarily digitizes scanned maps, plans and other line drawings with AutoCAD. All paper material is scanned at a resolution of 300 dpi to retain quality and display detail and digitized directly through “heads up” digitizing. The digital representation of published material is critical to our research as it allows for the data to be manipulated and associated related datasets. In addition, the digitizing process serves as an archive of the published material.
Cartographic Modeling & Spatial Analysis
The majority of our work involves the inherent tie between structure(s) and landscape. In combination with our digitization efforts, AML utilizes many methods to model the landscape, including: data collection in the field with DGPS-enabled total stations, rovers, stations and handheld units; digitization of printed topographic maps; digitization of aerial and satellite imagery and the use of space-based radar data (SRTM90).
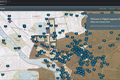
Analysis of cartographic models occur within a geospatial environment utilizing two unique but related software platforms: GIS-based software (ArcGIS & ERDAS) and the Google suite of Earth/Maps/SketchUp. Working within a GIS-capable platform provides a series of tools for projection, manipulation and analysis unique to geographic space. Recently, the capabilities of Google Earth, Google Maps and Google SketckUp have been enhanced sufficiently to challenge the capabilities of GIS, providing many of the same capabilities as GIS, but in a cost-effective, platform independent format designed specifically for internet-based collaboration and content sharing.
Multi-dimensional Visualization
Much of the work conducted by AML follows a flexible yet direct series of steps – data collection, data modeling, data analysis and data visualization – all rooted in a desire to record data as accurately as possible. A final step in our methodological process involves the visualization of all processed data within a two, three and sometimes fourth dimensional environment. Two dimensional representations, commonly referred to as “plan view” are essential for accurate schematic representation, publication and orientation. Three dimensional representations are a richer graphical representation both for the scholar and the general public. A three-dimensional landscape provides a sense of elevation, where a two-dimensional representation can not. In addition, three-dimensional representations can combine 3D features (buildings, roads and landscapes), further illustrating the scale, volume and relationship of the historic space. A final representation involves applying time-based animation as a fourth-dimensional representation. Many interpretation and orientation possibilities are available by combining 3D and 4D concepts within a web-based environment.
Technologies In Use @ AML
Hybridized mobile & web applications
Hybridized mobile/web hardware
Survey grade GPS
GPS enabled cameras
Multi-dimensional photography
Internet2 capabilities for cloud computing and video conferencing
Software In Use @ AML
Geographic Information Systems – ArcGIS and ArcGIS Pro
Graphic Design – Adobe Suite
Drafting – Autodesk Suite
Mapping – Google Earth, Google Maps
Visualization & Rendering – Adobe Suite, Autodesk Revit and 3ds Max, Rhino, Google SketchUp